


Introduction
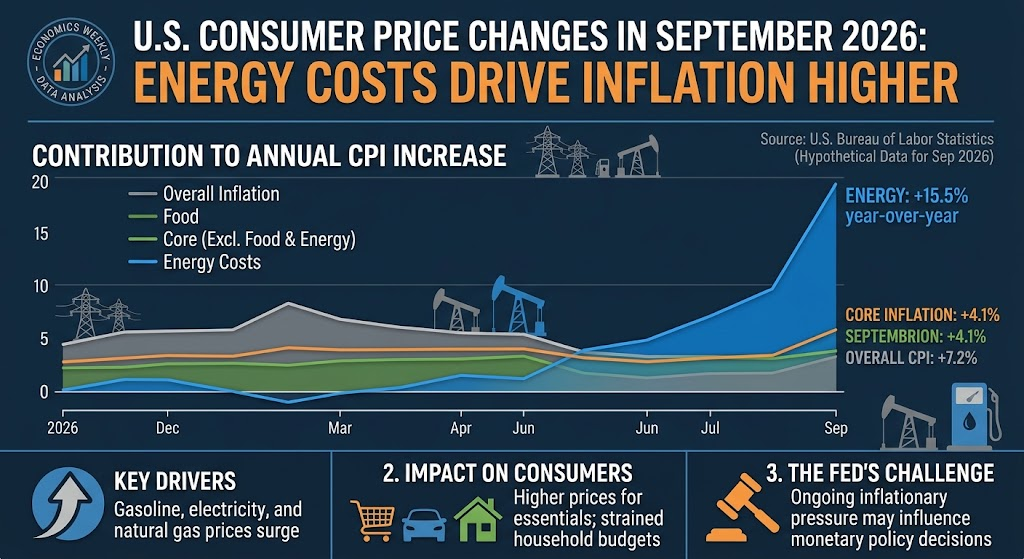
U.S. consumer prices increased across several major expenditure categories over the 12 months through September 2026, with energy costs recording the largest increases among the selected Consumer Price Index (CPI-U) measures.
According to data from the U.S. Bureau of Labor Statistics (BLS), the all-items CPI increased 3.7% over the 12-month period. Energy prices rose substantially faster, increasing 20.4%, while gasoline climbed 34.2% and fuel oil rose 74.2%.
The figures provide a snapshot of how price changes were distributed across household spending categories. Food prices increased at a more moderate pace, while the index for all items less food and energy rose 2.6%.
What the September 2026 CPI Data Measures
The Consumer Price Index measures changes over time in the prices paid by consumers for a broad range of goods and services. The figures presented here are unadjusted 12-month percentage changes for September 2026.
The categories are not mutually exclusive. For example, food includes both food at home and food away from home, while energy includes components such as gasoline, fuel oil, electricity and utility gas service.
This means the 10 figures should not be added together or treated as a ranking of separate contributions to overall inflation.
10 U.S. Consumer Price Changes in September 2026
| # | Expenditure Category | 12-Month Change |
|---|---|---|
| 1 | All items | +3.7% |
| 2 | Food | +2.5% |
| 3 | Food at home | +1.8% |
| 4 | Food away from home | +3.5% |
| 5 | Energy | +20.4% |
| 6 | Gasoline (all types) | +34.2% |
| 7 | Fuel oil | +74.2% |
| 8 | Electricity | +4.4% |
| 9 | Utility (piped) gas service | +5.0% |
| 10 | All items less food and energy | +2.6% |
Source: U.S. Bureau of Labor Statistics, Table A. September 2026 unadjusted 12-month percent changes. Data checked October 18, 2026.

Energy Prices Were the Largest Source of Price Pressure Among Selected Categories
Energy recorded a 20.4% 12-month increase in September 2026, substantially above the 3.7% increase in the all-items CPI.
The individual energy components showed particularly wide differences. Gasoline prices increased 34.2%, while fuel oil recorded a 74.2% increase. Electricity rose 4.4%, and utility piped gas service increased 5.0%.
The differences illustrate why the broad energy index can conceal significant variation among household energy expenses. Consumers dependent on different fuels can therefore experience substantially different price changes.
Fuel Oil Recorded the Largest Increase
Fuel oil had the highest 12-month increase among the 10 measures, at 74.2%.
That figure is substantially higher than the increase in gasoline and other listed energy categories. Because fuel oil represents a narrower expenditure category than the overall energy index, its percentage change should not be interpreted as the rate at which all household energy expenses increased.
Gasoline Prices Rose 34.2%
Gasoline recorded a 34.2% increase over the 12 months through September 2026.
Fuel prices can have effects beyond the direct cost paid at the pump. Transportation expenses influence household budgets and can also affect businesses whose costs depend on fuel-intensive logistics and transportation.

Food Inflation Was More Moderate
Food prices increased 2.5% over the 12-month period, below the 3.7% increase in the all-items CPI.
Within food, the two reported components showed different rates of increase.
Food at home rose 1.8%, while food away from home increased 3.5%. The difference indicates that consumers purchasing meals prepared outside the home experienced a faster annual increase than consumers buying food for preparation at home, based on these CPI measures.
The food category includes both components, so the separate percentages should not be interpreted as independent additions to the overall food inflation rate.
Underlying Price Growth Was 2.6% Excluding Food and Energy
The CPI measure for all items less food and energy increased 2.6% over the 12 months through September 2026.
Economists and policymakers often examine this measure alongside headline inflation because food and energy prices can experience substantial fluctuations. It does not mean that food and energy prices are unimportant to households; rather, excluding them provides another way of examining price movements across the remaining CPI categories.
The September figure of 2.6% was below the 3.7% all-items increase, reflecting the significant increase recorded by energy prices.

What the Price Changes Mean for U.S. Households
The impact of inflation varies according to household spending patterns.
A household with substantial gasoline or fuel-oil expenses can face a larger increase in its living costs than one with relatively limited exposure to those categories. Similarly, households that frequently purchase meals away from home may experience different food-related price changes from households that primarily prepare meals at home.
The 3.7% all-items increase therefore represents a broad average measure rather than an identical increase in every household’s cost of living.
Energy prices can also have indirect effects. Higher transportation and energy costs can influence the operating expenses of businesses, potentially affecting prices for other goods and services. The size and timing of those effects can vary across industries.
Risks and Limitations of the September CPI Figures
The figures are 12-month percentage changes, so they compare September 2026 prices with prices in September 2025. They do not show how prices changed during September alone.
The data is also unadjusted, meaning these figures should not be confused with seasonally adjusted monthly CPI changes commonly used to evaluate short-term inflation movements.
Another important limitation is the overlap among categories. Food at home and food away from home are components of food, while gasoline, fuel oil, electricity and utility gas service are components of energy. Consequently, the 10 figures cannot be combined to calculate total inflation.

Finally, CPI measures changes in a representative basket of consumer expenditures. Individual households may experience different effective inflation rates depending on what they purchase and how their spending is allocated.
Future Outlook for U.S. Consumer Prices
Future inflation readings will depend on developments across energy, food and other consumer categories. Energy prices can have particularly large effects on headline inflation when fuel costs move sharply.
Monitoring the relationship between headline CPI and the all items less food and energy measure can provide additional context. In September 2026, the two measures stood at 3.7% and 2.6%, respectively.
Subsequent BLS releases will show whether the unusually large energy increases recorded in September persist, moderate or reverse. Longer-term assessment will require multiple monthly observations rather than relying on a single 12-month reading.
Conclusion
The September 2026 U.S. CPI data shows a clear divergence between energy prices and several other major consumer categories. Overall consumer prices increased 3.7%, while energy rose 20.4%. Gasoline increased 34.2%, and fuel oil recorded a 74.2% increase.
Food prices rose 2.5%, with food at home increasing 1.8% and food away from home rising 3.5%. Excluding food and energy, consumer prices increased 2.6%.
The figures highlight the uneven nature of inflation across household expenditure categories. They also demonstrate why headline inflation needs to be considered alongside individual components and broader measures when assessing changes in consumer prices.

