


Introduction
The U.S. labor market is projected to generate millions of job openings annually across a wide range of occupations between 2025 and 2035, with the largest volumes concentrated in food service, healthcare support, retail, transportation, office administration and other occupations with substantial replacement demand.
According to the U.S. Bureau of Labor Statistics (BLS) occupational projections shown in the supplied data, fast food and counter workers are projected to have the largest number of annual job openings, at 827,400 per year. Home health and personal care aides follow with 760,500, while cashiers and retail salespersons account for 521,300 and 520,600, respectively.
The figures are particularly relevant for workers, employers and researchers examining where the U.S. economy is expected to generate the greatest number of employment opportunities. Importantly, annual openings reflect both employment growth and the need to replace workers who leave an occupation, rather than representing only newly created jobs.
What Annual Job Openings Mean
The BLS measure of annual job openings is broader than net employment growth.
An occupation can have a large number of openings even when its total employment is growing slowly or declining. This occurs because employers must continue replacing workers who leave their occupations, including through retirement and other forms of occupational separation.
The projections in the supplied data cover 2025–2035 and use annual average openings. The methodology states that annual openings include growth and replacement needs.
This distinction is important when interpreting the ranking. A position near the top does not necessarily mean that the occupation will experience the fastest employment growth.
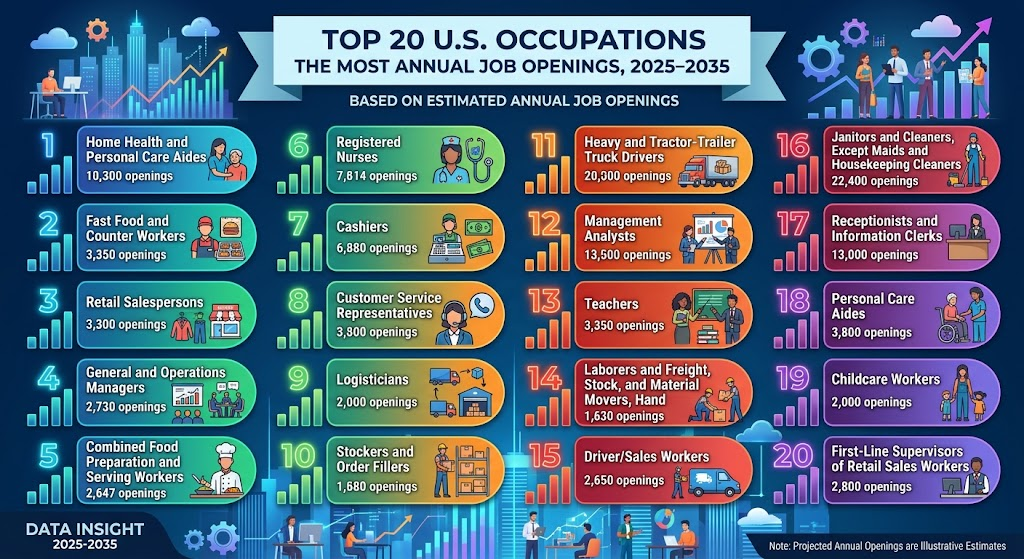
Top 20 U.S. Occupations by Projected Annual Job Openings
| Rank | Occupation | Projected Annual Job Openings |
|---|---|---|
| 1 | Fast food and counter workers | 827,400 |
| 2 | Home health and personal care aides | 760,500 |
| 3 | Cashiers | 521,300 |
| 4 | Retail salespersons | 520,600 |
| 5 | Stockers and order fillers | 430,700 |
| 6 | Waiters and waitresses | 423,100 |
| 7 | Laborers and freight, stock, and material movers, hand | 340,500 |
| 8 | Janitors and cleaners, except maids and housekeeping cleaners | 321,800 |
| 9 | Customer service representatives | 289,500 |
| 10 | General and operations managers | 285,000 |
| 11 | Office clerks, general | 249,000 |
| 12 | Cooks, restaurant | 218,600 |
| 13 | Heavy and tractor-trailer truck drivers | 214,500 |
| 14 | Nursing assistants | 196,200 |
| 15 | Registered nurses | 180,800 |
| 16 | Teaching assistants, except postsecondary | 176,200 |
| 17 | Maids and housekeeping cleaners | 175,500 |
| 18 | First-line supervisors of food preparation and serving workers | 171,500 |
| 19 | Secretaries and administrative assistants, except legal, medical, and executive | 163,900 |
| 20 | Security guards | 156,000 |
Source: U.S. Bureau of Labor Statistics. Projection period: 2025–2035. The supplied source was checked October 19, 2026. Annual average openings include growth and replacement needs.
Which U.S. Occupations Have the Most Projected Openings?
Fast Food and Counter Workers Lead the Ranking
Fast food and counter workers top the list with 827,400 projected annual openings.

The figure is substantially higher than the 760,500 annual openings projected for home health and personal care aides. The two occupations alone account for more than 1.5 million projected openings annually in the supplied ranking.
The high volume reflects the size and turnover characteristics of these occupations as well as projected employment needs. It should not be interpreted as 827,400 newly created positions each year.
Healthcare Support Is a Major Source of Demand
Healthcare-related occupations feature prominently in the ranking.
Home health and personal care aides account for 760,500 annual openings, the second-highest total. Nursing assistants are projected to have 196,200, while registered nurses are projected to have 180,800 annual openings.
The presence of several healthcare occupations reflects the scale of the healthcare workforce and the need to replace workers over time.
Retail and Food Service Remain Highly Represented
Retail and food-service occupations account for several of the largest totals.
Cashiers are projected to have 521,300 annual openings, while retail salespersons are projected at 520,600. Stockers and order fillers account for 430,700, and waiters and waitresses for 423,100.
Restaurant cooks are projected to have 218,600 openings annually, while first-line supervisors of food preparation and serving workers account for 171,500.
The concentration of these occupations demonstrates how large employment sectors can generate significant replacement demand even when their projected employment growth differs.
Transportation, Logistics and Cleaning Occupations
The ranking also includes several occupations connected to physical distribution and facilities management.
Laborers and freight, stock, and material movers, hand are projected to have 340,500 annual openings. Heavy and tractor-trailer truck drivers follow with 214,500.
Cleaning occupations also account for substantial projected openings. Janitors and cleaners, except maids and housekeeping cleaners are projected at 321,800, while maids and housekeeping cleaners account for 175,500.
These occupations illustrate the diversity of the U.S. labor market and the importance of replacement demand in large workforces.
Office and Administrative Jobs Remain a Significant Source of Openings
Several office-based occupations appear in the top 20.
Customer service representatives are projected to have 289,500 annual openings, followed by general and operations managers at 285,000 and office clerks, general at 249,000.
The ranking also includes secretaries and administrative assistants, except legal, medical, and executive, with 163,900 projected annual openings.
The presence of these occupations does not necessarily indicate that each will experience strong employment growth. Annual openings incorporate replacement requirements, which can be substantial in occupations with large existing workforces.
How Replacement Demand Changes the Picture
One of the most important considerations when using BLS occupational projections is the distinction between job openings and employment growth.
Suppose an occupation has a large workforce but relatively little projected expansion. If many existing workers leave the occupation over the projection period, employers will still need to fill those positions.
Conversely, a smaller occupation could experience rapid percentage employment growth while producing fewer total annual openings because its overall workforce is smaller.
For this reason, a ranking of annual openings answers a different question from a ranking of the fastest-growing occupations.
Risks and Limitations of the Projections
Occupational projections are estimates rather than guarantees of future employment conditions.
Actual hiring can differ from projections because of changes in economic growth, consumer demand, technology, business investment, demographics and employer practices.
The annual-opening figures also should not be interpreted as the number of permanent new positions created every year. Replacement needs form an important component of the BLS measure.
Another limitation is that the ranking does not provide information about wages, educational requirements, licensing, working conditions or geographic availability. Those factors vary substantially between occupations and would need to be examined separately.
The figures also represent national projections. Labor-market conditions for an occupation can differ considerably between individual states, metropolitan areas and industries.
What the Ranking Means for the U.S. Labor Market
The distribution of projected openings shows that employment demand is not concentrated exclusively in high-skilled professional occupations.

The list includes healthcare workers, retail employees, food-service workers, transportation workers, cleaners, administrative employees, managers and security personnel.
This reflects the structure of the U.S. economy, where occupations with large workforces can generate considerable annual replacement requirements. It also demonstrates why total job openings should be evaluated separately from measures of productivity, wage growth and occupational growth rates.
For international workers and people examining the U.S. employment market, the figures provide a broad indication of occupational demand but do not establish eligibility to work in the United States. Immigration status, work authorization, professional licensing and employer requirements are separate considerations.
Future Outlook for U.S. Occupational Openings
The 2025–2035 BLS projections provide a framework for evaluating expected labor-market demand over the decade. The composition of annual openings will depend on both projected employment growth and worker replacement needs.
Demographic changes may remain relevant to healthcare and personal-care occupations, while technology, automation and changes in consumer behavior can affect the structure of other industries.
The projections should therefore be treated as a baseline for understanding expected labor demand rather than a fixed forecast of the number of positions that will actually be filled each year.
Conclusion
The BLS projections show that the U.S. labor market is expected to generate large numbers of annual openings across both service and professional occupations during 2025–2035.
Fast food and counter workers rank first with 827,400 projected annual openings, followed by home health and personal care aides at 760,500. Cashiers and retail salespersons are next, with 521,300 and 520,600, respectively.
Healthcare, transportation, retail, food service, cleaning and administrative occupations all feature prominently in the top 20. The ranking should be read as a measure of projected annual openings, including replacement needs, rather than as a list of the occupations expected to create the most new jobs.

