


Introduction
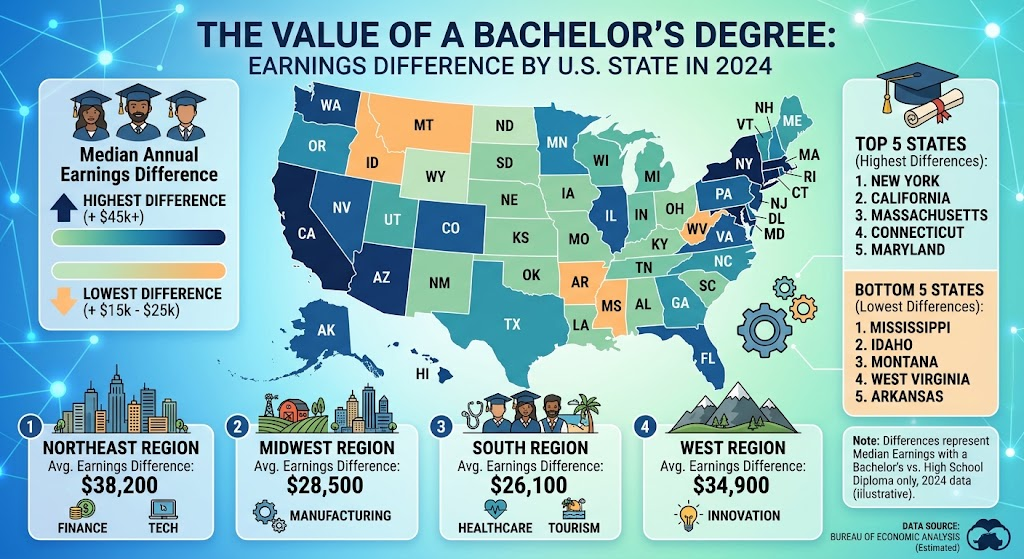
The economic value associated with holding a bachelor’s degree varies considerably across the United States. The supplied 2024 U.S. Census Bureau American Community Survey (ACS) dataset shows reported additional earnings associated with a bachelor’s degree ranging from $3K in the District of Columbia to $24K in California.
California recorded the largest reported earnings difference, followed by Georgia at $19K, New Jersey at $19K, New York at $19K, Texas at $18K and Washington at $18K. At the lower end, North Dakota and South Dakota each recorded $7K, while Wyoming was listed at $4K.
The figures illustrate that the relationship between educational attainment and earnings differs across state labor markets. However, an “earnings boost” should not be interpreted as a guaranteed financial return from obtaining a degree. Census earnings statistics describe differences between groups and do not by themselves establish that the degree caused the difference.
What the Bachelor’s Degree Earnings Data Measures
The American Community Survey collects information on educational attainment and earnings across U.S. states and the District of Columbia. Census tables report median earnings by educational attainment, with earnings expressed in inflation-adjusted dollars for the relevant survey year. Census Data
The supplied state-level figures are presented as additional earnings with a bachelor’s degree, expressed in thousands of dollars. They should therefore be read as the reported difference associated with the dataset’s underlying comparison rather than as an individual’s guaranteed annual salary increase after completing college.
This distinction matters because earnings are affected by numerous factors beyond education, including occupation, work experience, industry, age, hours worked, location and labor-market conditions.
Bachelor’s Degree Earnings Difference by State
| State / District | Additional Earnings with a Bachelor’s Degree |
|---|---|
| Alabama | $11K |
| Alaska | $12K |
| Arizona | $16K |
| Arkansas | $11K |
| California | $24K |
| Colorado | $14K |
| Connecticut | $16K |
| Delaware | $14K |
| District of Columbia | $3K |
| Florida | $13K |
| Georgia | $19K |
| Hawaii | $10K |
| Idaho | $10K |
| Illinois | $16K |
| Indiana | $11K |
| Iowa | $11K |
| Kansas | $14K |
| Kentucky | $11K |
| Louisiana | $13K |
| Maine | $15K |
| Maryland | $14K |
| Massachusetts | $15K |
| Michigan | $13K |
| Minnesota | $14K |
| Mississippi | $11K |
| Missouri | $12K |
| Montana | $8K |
| Nebraska | $11K |
| Nevada | $14K |
| New Hampshire | $11K |
| New Jersey | $19K |
| New Mexico | $10K |
| New York | $19K |
| North Carolina | $15K |
| North Dakota | $7K |
| Ohio | $16K |
| Oklahoma | $13K |
| Oregon | $16K |
| Pennsylvania | $17K |
| Rhode Island | $12K |
| South Carolina | $14K |
| South Dakota | $7K |
| Tennessee | $11K |
| Texas | $18K |
| Utah | $11K |
| Vermont | $8K |
| Virginia | $15K |
| Washington | $18K |
| West Virginia | $13K |
| Wisconsin | $13K |
| Wyoming | $4K |
Source: U.S. Census Bureau, American Community Survey 2024, as supplied. Amounts are reported in the source as additional earnings and rounded to the nearest $1,000.
California Reports the Largest Earnings Difference
California has the highest figure in the supplied dataset, at $24K.
The state has a large and diverse economy spanning technology, professional services, healthcare, entertainment, manufacturing and other industries. Such differences in industry composition can affect the earnings associated with different education levels.

The California figure should not, however, be interpreted as saying that every bachelor’s degree holder earns exactly $24K more than a worker without one. The statistic represents a population-level earnings difference rather than an individual outcome.
Several Large State Economies Report Differences of $18K or More
A number of major U.S. economies appear near the upper end of the dataset.
Georgia, New Jersey and New York each record $19K in additional earnings. Texas and Washington each report $18K, while Pennsylvania records $17K.
Arizona, Connecticut, Illinois and Ohio each show $16K. Oregon also records $16K.
These differences can reflect the composition of local economies, occupational structures and the types of jobs available to workers with different levels of educational attainment.
Why the Earnings Difference Varies by State
Industry Composition
States have different concentrations of industries and occupations. A state with a large professional, technology, financial or scientific-services workforce can have a different education-earnings relationship from a state where employment is more concentrated in industries with lower formal educational requirements.
Occupation and Field of Study
A bachelor’s degree is not a single labor-market qualification. Earnings can vary substantially by field of study and occupation.
The Census Bureau’s 2024 ACS data separately reports earnings by field of bachelor’s degree. Its national data, for example, distinguishes science and engineering, business, education, arts and other fields. Census Data
This means the state-level difference does not describe the financial outcome of every bachelor’s degree equally.
Work Experience and Age
Workers with bachelor’s degrees can differ from other workers in age, experience and occupational seniority. These characteristics can influence earnings independently of educational attainment.
Local Labor Markets
Earnings also reflect local labor-market conditions. The same occupation can have different pay levels across states because of differences in demand, employer concentration, living costs and other economic conditions.
The District of Columbia and Other Low-Difference Areas
The supplied dataset places the District of Columbia at $3K, the lowest reported figure.
Wyoming follows at $4K, while North Dakota and South Dakota each record $7K. Montana and Vermont each show $8K.
These figures should be interpreted cautiously. A relatively small difference in a state-level dataset does not necessarily mean that higher education has little economic value in that location. Differences in the underlying population, occupational mix, earnings distributions and statistical methodology can affect the result.
The District of Columbia is also structurally different from the 50 states because it is a densely populated federal district with a distinctive employment base.
How the Census Measures Earnings
Census Bureau earnings tables typically report median earnings, rather than the average. The median identifies the middle point of an earnings distribution: half of the relevant population earns more and half earns less.
For the national population age 25 and over with earnings, the 2024 ACS 5-year detailed table reports median earnings of $70,044 for bachelor’s degree holders, compared with $40,153 for high school graduates. Census Data
Those national figures provide important context but should not be substituted for the state-level figures supplied above. Different Census tables can use different universes, age ranges and educational-attainment definitions.
A Bachelor’s Degree Does Not Guarantee a Fixed Earnings Premium
The term “earnings boost” can make the relationship appear more certain than the data supports.
A statistical association between education and earnings does not establish that obtaining a degree alone caused a particular dollar increase. People who earn bachelor’s degrees can differ systematically from people with lower educational attainment in ways that also affect earnings.
Occupation is particularly important. A bachelor’s degree can be a prerequisite for some professional careers, while it may provide less direct earnings differentiation in other occupations.
Financial outcomes also depend on the cost of obtaining the degree, including tuition, fees, living expenses and potential foregone earnings while studying. The supplied Census figures do not measure those costs.
Risks and Limitations of the State Comparison
The figures should not be interpreted as a ranking of the return on investment from college.
First, earnings are not the same as income after taxes or disposable income. Second, the figures do not account for the cost of education or student debt.
Third, state-level comparisons can conceal large differences within states. Earnings can vary between metropolitan areas, rural communities, industries and occupations.
Fourth, the ACS is a survey and its estimates have margins of error. Close differences should therefore not automatically be interpreted as statistically significant.
Finally, the supplied dataset describes an earnings difference but does not establish causality. The figures show an association between educational attainment and earnings, not a guaranteed personal financial outcome.
What the Data Means for the U.S. Labor Market
The state variation highlights the importance of looking beyond national averages when examining education and earnings.
A bachelor’s degree can be associated with substantially different earnings outcomes depending on where a worker lives and the occupation in which they work. The highest reported difference in this dataset, $24K in California, is six times the $4K reported for Wyoming.
At the same time, the relationship between education and earnings is broader than a single state-level figure. Census data shows a clear national earnings gradient across educational-attainment categories, with bachelor’s degree holders earning more at the median than high school graduates and people with some college or an associate’s degree. Census Data
Future Outlook for Education and Earnings
The relationship between education and earnings is likely to continue evolving as the U.S. labor market changes.
Technology, automation, artificial intelligence, industry restructuring and changes in occupational requirements can alter the value employers place on different skills and credentials. At the same time, demand for workers in healthcare, technology, professional services and other degree-intensive occupations can influence regional earnings patterns.
Future ACS releases will provide additional data for examining whether the earnings differences between education groups are widening or narrowing across states.
Long-term analysis is more informative than a single-year comparison because it can identify whether changes represent temporary labor-market conditions or more persistent structural differences.
Conclusion
The 2024 state-level dataset shows substantial variation in the reported earnings difference associated with holding a bachelor’s degree.
California recorded the largest figure at $24K, followed by Georgia, New Jersey and New York at $19K each. Texas and Washington recorded $18K, while Pennsylvania reported $17K. At the other end, the District of Columbia was listed at $3K, Wyoming at $4K, and North Dakota and South Dakota at $7K.
The figures demonstrate that education and earnings are closely linked in U.S. labor-market data, but they should not be interpreted as guaranteed returns from earning a degree. Earnings depend on education as well as occupation, industry, experience, location and other characteristics.
The Census Bureau’s 2024 ACS data provides a useful statistical basis for examining these relationships, but assessing the economic value of a bachelor’s degree requires considering both earnings and the costs and circumstances associated with obtaining the credential.

